We have all seen it before: the Board President stands up at the annual meeting and announces that assessment rates for the HOA will go up by $10.00. People jump from their chairs to run screaming for the door while others curl up into the fetal position and rock back and forth. Ok…maybe it isn’t that bad,but if you have ever tried to raise assessment rates you know, it is rarely met with someone thanking you for your wise fiscal decision. So when is the right time to do it? I have talked to some boards that tell me their goal is never to raise their rates and while I certainly appreciate their desire to stay fiscally responsible, running an HOA is like running any other business. You have to proactively measure cost increases to stay ahead of the power curve, and if you are raising assessments to try to catch up to the higher rates of the previous year, your association will always be behind.
So what can you do to get ahead of your long-term hoa budget planning? Statistics are here to help! You can use correlation and regression to determine when and how much to raise assessments (and if you just say you want to use correlation and regression to determine future budgetary needs at a meeting people will automatically add about 10 IQ points to you).
|
Association Total Expenses |
|
|
10 |
115001 |
|
11 |
110914 |
|
12 |
114871 |
|
13 |
152083 |
|
14 |
144548 |
|
15 |
177778 |
|
16 |
205911 |
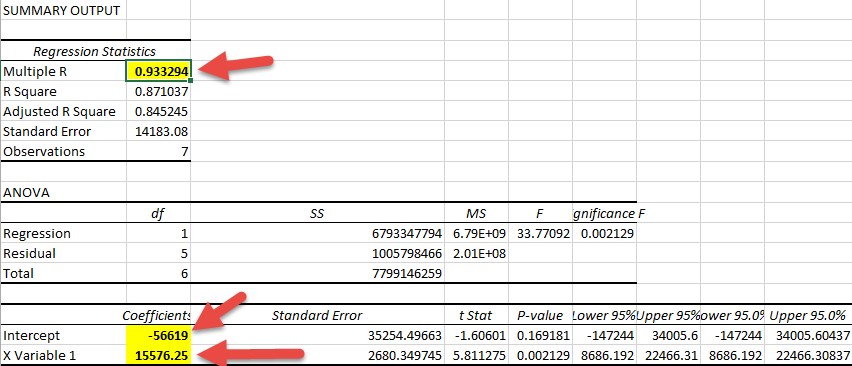
The example I will use to prove this point is a 500 home community located here in Colorado, where seven years of population growth have seen standard year over year increases in overall costs. The chart here shows the past seven years of total association expenses, and even a quick glance will tell you that their costs are on average increasing. Using any standard spreadsheet program on your computer, you can use these numbers to calculate the correlation of what each year adds in terms of cost. For example, in Excel you can click on “Data Analysis” and then click on “Regression”, and it will produce a scary looking chart with a lot of numbers. Fear not! You only need 3 of those numbers, which are highlighted here:

The first number lets you know how strong the correlation is, and will be between 0 and 1. The closer to 1 that number is, the stronger the correlation and thus the more accurate your regression will be for future predictions. In this case, the number is .9333, which means a high correlation. That was easy enough! The next two numbers can be used in a simple equation, which is Y=A+BX. Y is the future budget number we want to solve for, A is the intercept, B is the year we are looking for, and X is the X Variable. To play this out, let’s take a look at what the expected expenses will be for this community in 2020: Y = (-56,619) x 20(15,576), which comes out to 255,000/year (20 represents 2020 in this instance). If I wanted to look to see what estimated expenses are for 2018, the formula is Y = (-56,619) x 18(15,576), or 223,800.
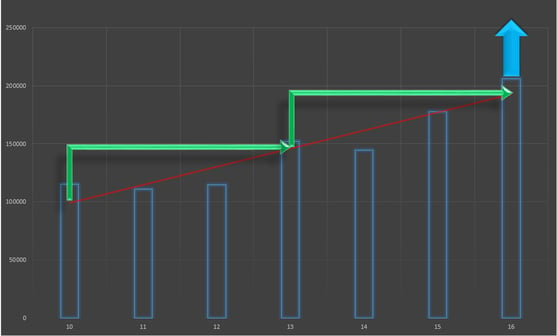
The next big question you should ask yourself in this process is “How often should our association raise assessments?” Each association is different, and it might be easier to raise every four years rather than every two years. Shorter iterations can lead to more accuracy, but that can also feel like pulling teeth to tell homeowners that they owe more every year. Longer iterations can lead to less accuracy and payments that are higher than necessary but might be an easier pill to swallow for communities who don’t like to raise assessments too often. The chart below shows a three-year cycle for raising assessments. If we want to raise amounts to prepare for 2019, the formula = (-56,619) x 19(15,576), which is 239,325 and a difference of 33,414 from the 2016 total expenses which is around $67 per homeowner per year, or an increase of $5.60 per homeowner per month.

This process not only prepares homeowners for a standardized, predictable assessment rate, but it also generates additional revenue which can be applied to the reserve account to save for a rainy (or snowy) day.
And there you have it! Knowing how to discuss regression statistics is a fantastic tool for being left alone at parties, falling asleep when you have insomnia, and most importantly for regulating your association’s budgetary needs! Just review these simple numbers, and I guarantee you will sound like the smartest person in the room at your next association meeting.


